Thermophysical Properties
Regression models are a cornerstone of thermophysical property prediction. They connect molecular structure to macroscopic properties such as melting point, boiling point, solubility, or surface tension. Over the years, researchers have developed a variety of approaches:
- Group Contribution (GC) Methods – Molecules are split into functional groups (e.g., –CH₃, –OH, –Cl), and each group adds a fixed contribution to the property. These methods are simple, interpretable, and widely used, but linear assumptions often limit accuracy for complex molecules.
- QSPR (Quantitative Structure–Property Relationships) – Use molecular descriptors (e.g., weight, dipole moment, topology indices) as regression inputs. These models capture more detail than GC but can be high-dimensional and hard to interpret.
- Corresponding States & Equations of State – Correlate unknown properties to critical constants or reference fluids. These approaches work well when critical data is available but degrade when extrapolated.
- Quantum Chemistry & Molecular Simulation – Predict properties from first principles. These are accurate but computationally expensive and impractical for large datasets.
- Machine Learning (ML) Methods – Neural networks, random forests, support vector regression, and graph-based models can capture nonlinear patterns and interactions. Unlike classical regression, ML can discover complex mappings directly from data, reducing prediction errors to within experimental uncertainty for many properties.
While classical regression is fast and interpretable, modern ML regression offers significant accuracy gains, especially when predicting properties like melting point across diverse chemical families.
🧪 Melting Point Prediction Challenge
Predicting the melting point of organic molecules is a long-standing challenge in chemistry and chemical engineering. Melting point is critical for drug design, material selection, and process safety, yet experimental measurements are often costly, time-consuming, or unavailable.
In this competition, you’ll use machine learning to predict melting points from group contribution features, subgroup counts that represent functional groups within each molecule. Your task is to build models that capture the complex, nonlinear relationships between molecular structure and melting behavior.
Evaluate your performance using Mean Absolute Error (MAE) on a held-out test set. Lower is better. Can you design models that generalize across diverse chemical families and push the limits of data-driven property prediction?
Dataset Description
- Total compounds: 3328
- Train: 2662 (80%)
- Test: 666 (20%)
Files
- melt_train.csv: Features + target (Tm)
- melt_test.csv: Features only, no target
Sample Submission
  id,Tm
  202,356
  203,312
  204,386
Columns
  id          : unique ID
  SMILES      : molecular string
  Group 1..N  : descriptor features
  Tm          : melting point (°C) [train only]
Links


Physics-Informed Machine Learning
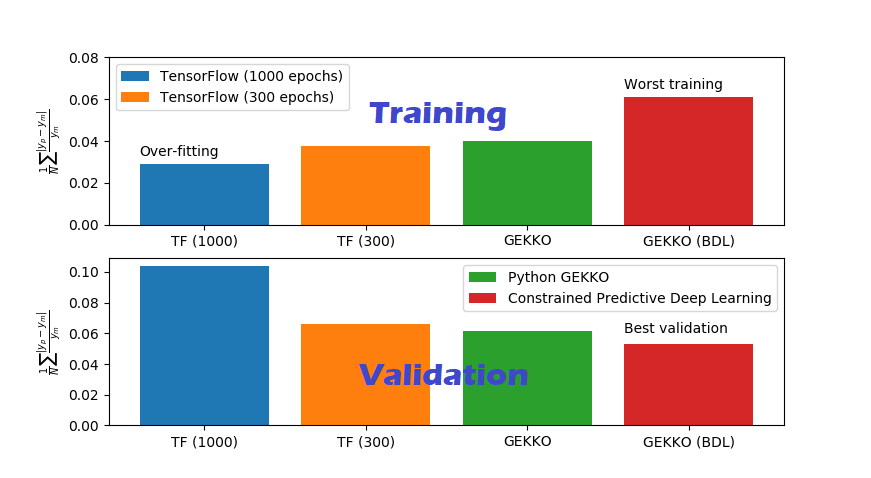
Empirical regression has limitations, especially when predictions are requested outside of the training region. Physics-based information can overcome this limitation by including fundamental engineering knowledge such as constraints during the training process.
Background: Parachor values are a factor in the prediction of several thermophysical properties such as surface tension and thermal conductivity. The parachor value (P) is used to predict surface tension with the difference between the density of saturated liquid `\rho_L` and saturated vapor `\rho_V` at the temperature of interest.
$$\sigma = \left(P \left(\rho_L-\rho_V\right)\right)^4$$
Surface tension and thermal conductivity are two specific properties that need improved predictions. A more accurate predictor of the parachor value (P) is an important step to improve those thermophysical properties. Most deep learning methods use a limited set of activation functions (ReLU, sigmoid, tanh, and linear) and perform unconstrained regression to minimize a loss function. The purpose of this case study is to explore the addition of physics-based information in the fitting process. This may include the use of new types of activation functions or constraints on the adjustable weights. The data for this case study is from Gharagheizi, et. al. (2011) who explored deep learning (a multi-layered neural network) to improve parachor predictions for 277 compounds from 40 functional groups.
- Name: The common chemical name
- Formula: Chemical formula of the compound
- CASN: Chemical Abstracts Service Registry Number
- Family: Chemical family of the compound
- Parachor: Estimate of parachor value
- Grp1-Grp40: Number of functional groups in the compound

Objective: Develop a prediction of the parachar from the chemical compound data set. Report the correlation coefficient (R2) for predicting Parachor in the test set. Randomly select values that split the data into a train (80%) and test (20%) set. Use Linear Regression and Neural Network (Deep Learning) with and without constraints. There is additional information on adding constraints to linear regression (see Gekko example) and to the neural network weights. For the constrained cases, enforce a positive parachor contribution for each group. Discuss the performance of each on the train and test sets. Submit source code and a summary memo (max 2 pages) of your results.
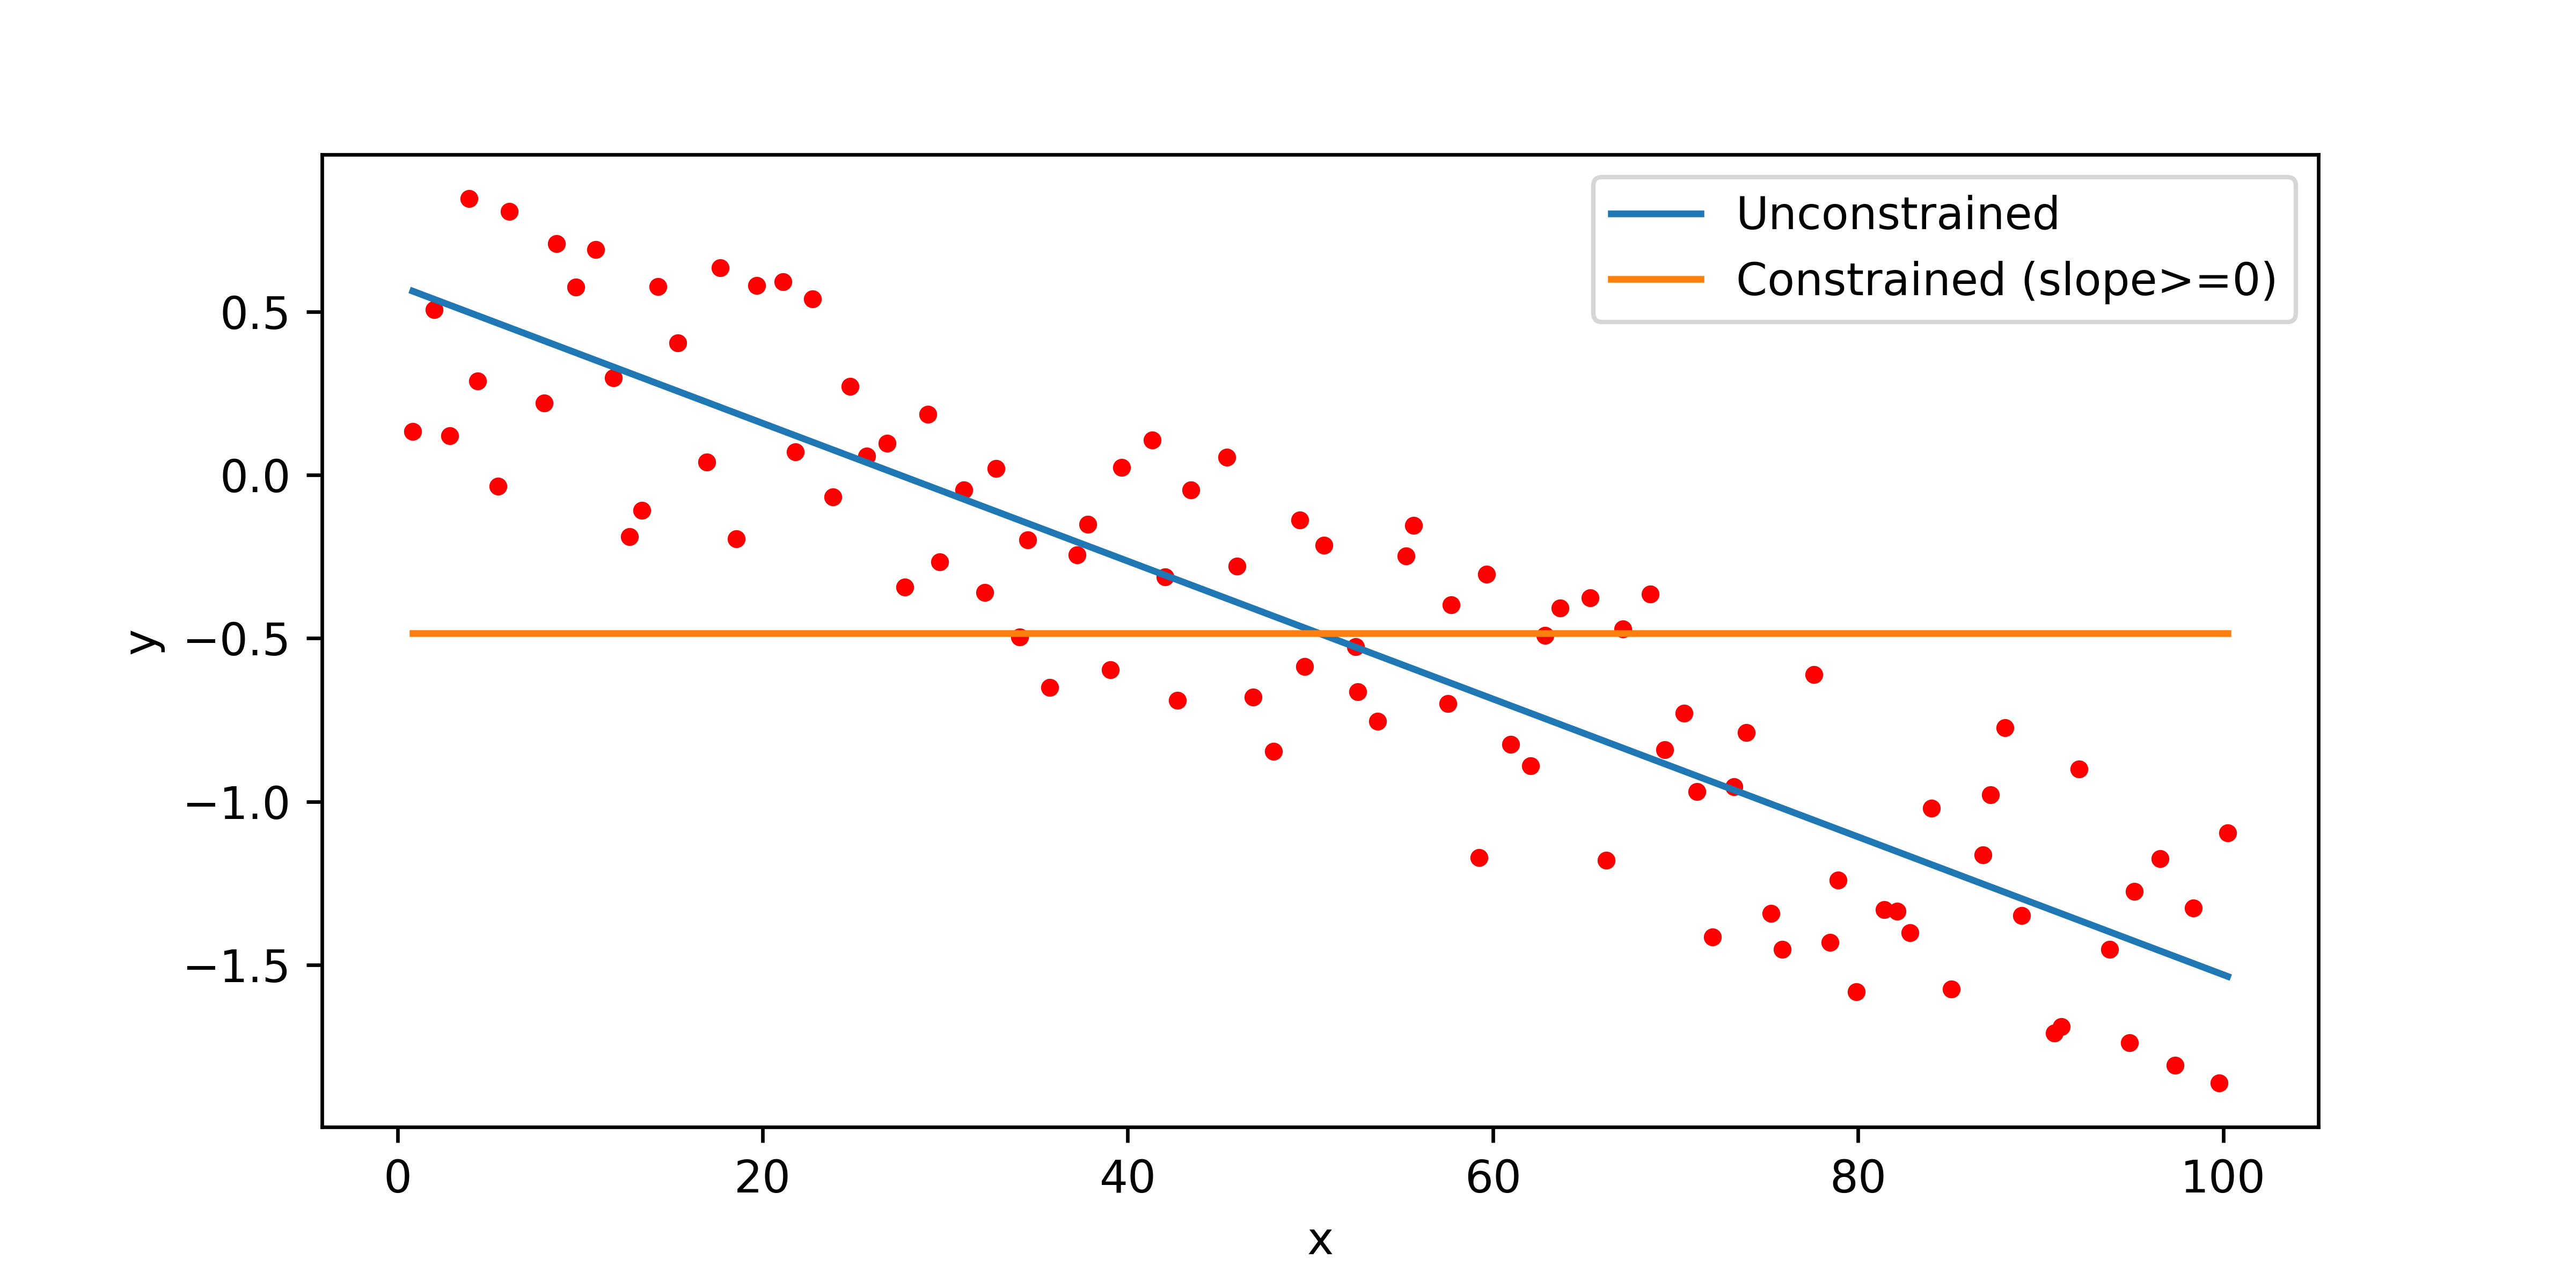
Constrained Linear Regression Example
Constraints on the parameters are possible with Python Gekko and Keras / TensorFlow. This example shows how to include a lower bound on the slope for linear regression with Python Gekko.
import numpy as np
import matplotlib.pyplot as plt
# define data
x = np.random.rand(100) + np.linspace(0,100,100)
y = np.random.rand(100) - 2*np.linspace(0,1,100)
# linear regression model with Gekko
m = GEKKO()
# unknown parameters
a,b = m.Array(m.FV,2)
a.STATUS = 1; b.STATUS = 1
# variables and parameters
yp = m.Var()
ym = m.Param(y)
xm = m.Param(x)
# equations and objective
m.Equation(yp == a*xm + b)
m.Minimize((yp-ym)**2)
# solve
m.options.IMODE = 2
m.solve(disp=False)
p1 = [a.value[0],b.value[0]]
print('Slope:', p1[0])
print('Intercept:', p1[1])
# add constraint to the slope (>=0)
a.LOWER = 0.0
m.solve(disp=False)
p2 = [a.value[0],b.value[0]]
print('Slope:', p2[0])
print('Intercept:', p2[1])
# plot results
plt.plot(x,y,'r.')
plt.plot(x,np.polyval(p1,x),label='Unconstrained')
plt.plot(x,np.polyval(p2,x),label='Constrained (slope>=0)')
plt.ylabel('y'); plt.xlabel('x'); plt.legend()
plt.show()
References
- F. Gharagheizi, A. Eslamimanesh, A. H. Mohammadi, and D. Richon, Determination of parachor of various compounds using an artificial neural network group contribution method, Industrial & Engineering Chemistry Research, vol. 50, no. 9, pp. 5815–5823, 2011.
- S. Sugden, Vi.-the variation of surface tension with temperature and some related functions, J. Chem. Soc., Trans., vol. 125, pp. 32–41, 1924. [Online]. Available: https://dx.doi.org/10.1039/CT9242500032
- T. A. Knotts, W. V. Wilding, J. L. Oscarson, and R. L. Rowley, Use of the DIPPR database for development of QSPR correlations: Surface tension, Journal of Chemical & Engineering Data, vol. 46, no. 5, pp. 1007–1012, 2001. [Online]. Available: https://doi.org/10.1021/je000232d
- F. Gharagheizi, A. Eslamimanesh, A. H. Mohammadi, and D. Richon, Use of artificial neural network-group contribution method to determine surface tension of pure compounds, Journal of Chemical & Engineering Data, vol. 56, no. 5, pp. 2587–2601, 2011.
- M.R. Babaei, R. Stone, T.A. Knotts, J.D. Hedengren, Physics-Informed Neural Networks with Group Contribution Methods, Journal of Chemical Theory and Computation, American Chemical Society, 2023, DOI: 10.1021/acs.jctc.3c00195.

Solutions