Bryson-Denham Problem
The Bryson-Denham optimal control problem is a benchmark test problem for optimal control algorithms.
Problem Statement
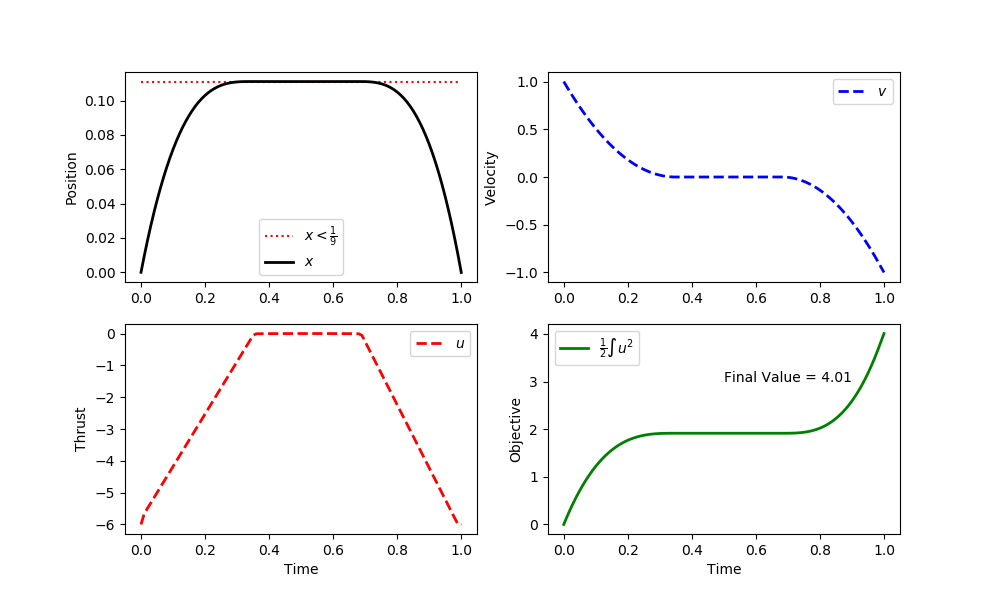
The parameter u (acceleration) is adjusted over the time horizon from a starting time of zero to a final time of one. The variable x is the position and v is the velocity.
$$\min J = \frac{1}{2} \; \int_0^1 u^2(t) dt$$
$$\mathrm{subject\;to}$$
$$\frac{dx(t)}{dt} = v(t) $$
$$\frac{dv(t)}{dt} = u(t) $$
$$x(0) \; = \; x(1) \; = \; 0$$
$$v(0) \; = \; -v(1) \; = \; 1$$
$$x(t) \le \ell, \; \ell=\frac{1}{9}$$
Solution
import numpy as np
import matplotlib.pyplot as plt
from gekko import GEKKO
m = GEKKO(remote=False)
nt = 101; m.time = np.linspace(0,1,nt)
# Variables
x = m.Var(value=0,ub=1/9)
v = m.Var(value=1)
u = m.Var(value=-6)
p = np.zeros(nt); p[-1] = 1.0
final = m.Param(value=p)
# Equations
m.Equation(x.dt()==v)
m.Equation(v.dt()==u)
# Final conditions
soft = True
if soft:
# soft terminal constraint
m.Minimize(final*1e5*x**2)
m.Minimize(final*1e5*(v+1)**2)
else:
# hard terminal constraint
xf = m.Param(); vf = m.Param()
m.free(xf); m.free(vf)
m.fix_final(xf,0); m.fix_final(vf,-1)
# connect endpoint parameters to x and v
m.Equations([xf==x,vf==v])
# Objective Function
obj = m.Intermediate(0.5*m.integral(u**2))
m.Minimize(final*obj)
m.options.IMODE = 6
m.options.NODES = 2
m.options.SOLVER = 2
m.solve()
# Create a figure
plt.figure(figsize=(10,4))
plt.subplot(2,2,1)
plt.plot([0,1],[1/9,1/9],'r:',label=r'$x<\frac{1}{9}$')
plt.plot(m.time,x.value,'k-',lw=2,label=r'$x$')
plt.ylabel('Position')
plt.legend(loc='best')
plt.subplot(2,2,2)
plt.plot(m.time,v.value,'b--',lw=2,label=r'$v$')
plt.ylabel('Velocity')
plt.legend(loc='best')
plt.subplot(2,2,3)
plt.plot(m.time,u.value,'r--',lw=2,label=r'$u$')
plt.ylabel('Thrust')
plt.legend(loc='best')
plt.xlabel('Time')
plt.subplot(2,2,4)
plt.plot(m.time,obj.value,'g-',lw=2,label=r'$\frac{1}{2} \int u^2$')
plt.text(0.5,3.0,'Final Value = '+str(np.round(obj.value[-1],2)))
plt.ylabel('Objective')
plt.legend(loc='best')
plt.xlabel('Time')
plt.show()